
What Montenegro’s PISA 2022 data says about the north, and what it cannot say
About half of the north’s disadvantage is socio-economic composition. The other half is not explained by who the students are or by which type of school they attend, and the largest divide in the data is not regional at all.
Download the full note (PDF) Preuzmite analizu (PDF, crnogorski)
Summary
Montenegro’s 15-year-olds averaged 405.6 score points in mathematics in PISA 2022. That single number is what an international report is built to deliver, and it is where most national discussion of PISA begins and ends. This note puts a different question to the same data, one the international volumes are not structured to answer: how large is the gap between Montenegro’s regions, and what is that gap actually made of.
What the data shows.
- Students in the north scored 25.0 points below students in the central region (2.5), and roughly half of that difference is socio-economic composition, since the gap net of the PISA index is 13.2 points (2.6) and remains clearly different from zero.
- The remaining gap is not explained by the school programmes northern students attend either. Adjustment for programme alongside socio-economic status leaves 16.0 points (2.5).
- The largest structural divide in the data is not regional at all: students in gimnazija programmes outscored students in vocational programmes by 79.0 points (2.3), and by 67.4 points at a constant socio-economic level, and the comparison covers the 53.5% of the cohort enrolled in vocational programmes.
- The mathematics anxiety index quoted alongside these gaps was tested for measurement equivalence across the same groups before any comparison was made, and it passed at the strict level under two different estimators.
This note is an independent contribution alongside the work of Montenegro’s national PISA centre and is not a commentary on that work. It uses only data made public by the OECD, and it is written so that every estimate in it can be reproduced. Comments and corrections from the national centre are welcome.
Why this question
Every country in PISA receives, on release day, a rank, a headline and an international report written for eighty education systems at once. What almost no country receives is an analysis of its own data at the resolution at which its own policy debate operates. Montenegro’s debate is not about where the country sits between Serbia and Croatia. It is about the north, about vocational schooling, and about whether the differences everyone quotes are real.
Those questions can be answered from data that already exists. The PISA 2022 Public Use Files have been openly downloadable since May 2024, they contain the record of every Montenegrin student in the sample, and their collection was paid for by Montenegro. What they require is analytical machinery capable of handling them properly – plausible values, replicate weights, and a willingness to establish that a comparison is measurement-supported before it is made.
Regions here are taken from the explicit sampling strata published for Montenegro, which cross school programme with north, central and south. That is the national centre’s own design variable and not a grouping invented by an outside analyst. It should be read as an analytical breakdown and not as official regional statistics, because Montenegro is not regionally adjudicated in PISA and no separate regional estimates are published for it.
The data, and how it was handled
5,793 students in 63 schools, representing a weighted population of 6,340 15-year-olds, from the OECD’s PISA 2022 student and school Public Use Files. National mean in mathematics: 405.6 points (SE 1.1), with a standard deviation of 81.6 points.
Two properties of these data defeat the naive analysis, and both are handled here. Achievement is imputed, not observed, so the estimation here proceeds by Rubin’s rules across all ten plausible values. The alternatives in common circulation – use of the first plausible value, or an average of the ten treated as a measurement – discard the between-imputation variance and produce an understatement of the standard error. The sample is clustered within schools, which is why the sampling variance here comes from the 80 Fay-adjusted balanced repeated replication weights supplied with the file (Fay factor 0.5), not from a simple-random-sample formula. Omit either correction and the reported uncertainty is too small, typically by a factor of two.
A method that produces plausible numbers is not the same as one that produces right numbers, so the machinery was first pointed at figures the OECD has already published for this country.
| Published by the OECD | Published | This analysis | SE |
|---|---|---|---|
| escs_quartile_gap | 67 | 66.56 | 3.68 |
| escs_variance_explained | 0.09 | 9.5% | 0.009 |
| reading_gender_gap | 36 | 35.70 | 2.22 |
Source: OECD, PISA 2022 Results (Volume I and II) Country Note: Montenegro, published 5 December 2023, https://www.oecd.org/en/publications/pisa-2022-results-volume-i-and-ii-country-notes_ed6fbcc5-en/montenegro_84d80839-en.html
The regional gap, and what survives adjustment
The three regions are far apart on a scale whose national standard deviation is 81.6 points.
| Region | Students | Share | Mean, mathematics | SE | Mean ESCS |
|---|---|---|---|---|---|
| North | 1,453 | 25.5% | 384.6 | 1.8 | -0.54 |
| Central | 2,995 | 52.0% | 409.6 | 1.7 | -0.10 |
| South | 1,345 | 22.6% | 420.1 | 2.6 | -0.07 |
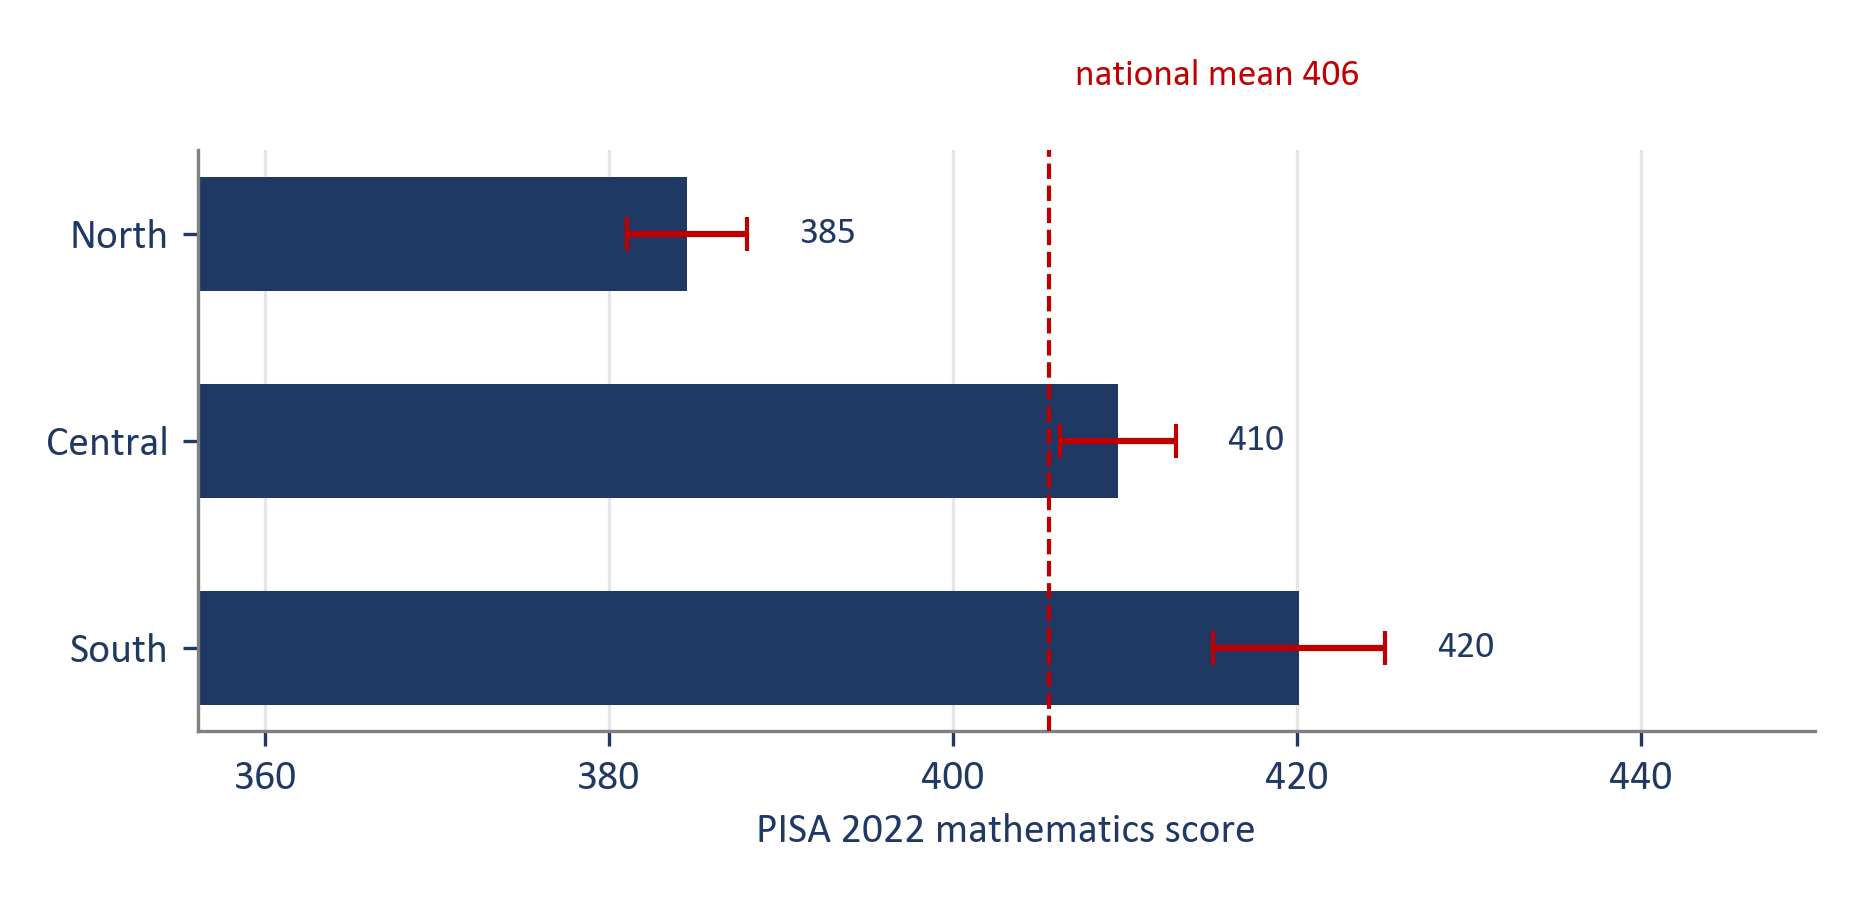
The obvious explanation is family background, and it is partly right. The north is markedly more disadvantaged (-0.54 on the PISA index against -0.10 in the centre), and each one-unit increase in that index is worth 29.3 score points nationally (1.4). Adjustment for it removes about half the gap and leaves the rest standing.
| Contrast | Unadjusted | SE | Net of ESCS | SE |
|---|---|---|---|---|
| North minus Central | -25.0 | 2.5 | -13.2 | 2.6 |
| South minus Central | 10.5 | 3.2 | 9.5 | 3.0 |
The south is the more surprising half of the picture. Its socio-economic profile is close to the centre’s (-0.07 against -0.10), so adjustment barely moves its advantage, from 10.5 points unadjusted to 9.5 points net of socio-economic status. Whatever is happening in the south is not a socio-economic story.
A second candidate explanation is that the north simply has a different mix of school programmes. Holding programme constant as well does not shrink the northern gap but widens it slightly, to 16.0 points below the centre, while the southern advantage widens to 14.0 points.
The policy reading is narrow and defensible. About half of the north’s measured disadvantage is the socio-economic composition of the region, and the other half is a difference in what happens to comparable students in comparable programmes. That second half is the part a regional policy instrument could in principle move.
The divide that is larger than the regional one
Regional debate is loud, and the data places a larger number somewhere else. The distance between gimnazija and vocational programmes is three times the gap between the north and the centre.
| School programme | Students | Share | Mean, mathematics | SE | Mean ESCS |
|---|---|---|---|---|---|
| Primary | 66 | 4.6% | 408.7 | 16.7 | -0.43 |
| Gimnazija | 1,293 | 21.5% | 461.1 | 2.1 | 0.24 |
| Vocational | 3,208 | 53.5% | 382.1 | 1.1 | -0.34 |
| Mixed | 1,226 | 20.3% | 408.0 | 2.2 | -0.27 |

| Contrast | Unadjusted | SE | Net of ESCS | SE |
|---|---|---|---|---|
| Primary minus Gimnazija | -52.4 | 16.8 | -39.3 | 16.3 |
| Vocational minus Gimnazija | -79.0 | 2.3 | -67.4 | 2.6 |
| Mixed minus Gimnazija | -53.2 | 3.3 | -43.3 | 3.6 |
Socio-economic selection into the two tracks is real and accounts for part of that distance, and only part, since the gap net of the index is still 67.4 points, roughly four fifths of a national standard deviation.
Two cautions belong here before anyone reaches for a conclusion. This is a difference of selection as much as a difference of school effect, and PISA cannot separate the two, because students are not randomly assigned to tracks and prior attainment is not measured. It is also measured at age 15, when tracking has only recently taken effect, so it says nothing directly about what the two tracks add over their full duration.
Can this comparison be trusted? A measurement audit
Everything above compares test scores, and test scores are placed on a common scale by construction, which is the guarantee that makes the comparison legitimate. That guarantee lapses the moment a report moves to the questionnaire indices, and the lapse is where national commentary on PISA most often goes wrong. An index of this kind – sense of belonging, teacher support, mathematics anxiety – is a scale score built from a handful of agree-or-disagree items, and comparing its mean across groups presumes both that the items carry the same meaning in every group and that they relate to the underlying construct in the same way. The presumption is testable. It is very rarely tested.
The obvious index to attach to these findings is mathematics anxiety, measured in PISA 2022 with six items and the most quoted explanatory variable in the mathematics cycle. Before any comparison across regions and programmes, the index was put through a staged measurement-invariance cascade.
| Model | Chi-square | df | CFI | RMSEA | SRMR | Decision |
|---|---|---|---|---|---|---|
| Configural | 306.76 | 27 | 0.951 | 0.144 | 0.036 | reference |
| Metric | 365.11 | 37 | 0.951 | 0.123 | 0.037 | supported |
| Scalar | 412.41 | 47 | 0.950 | 0.110 | 0.039 | supported |
| Strict | 407.10 | 59 | 0.950 | 0.099 | 0.039 | supported |
Measurement invariance of the mathematics anxiety block across region. N = 4,787. Estimator MLR. Decision rule after Chen (2007).
Verdict. Strict invariance held; loadings, intercepts, and residual variances are equivalent across groups, supporting comparison of observed means and (co)variances. Because a continuous estimator on four-category items can in principle distort this verdict, the cascade was refitted with a categorical estimator on pairwise-present data. It reached strict invariance, the same verdict, so the conclusion does not depend on the estimator.
Strict invariance held across regions, and a separate run reached the same verdict across school programmes. Because a continuous estimator on four-category items can in principle distort a verdict of that kind, the whole cascade was refitted with a categorical estimator on pairwise-present data, and strict invariance was reached again in both groupings, so the conclusion does not depend on the estimator.
One honest qualification belongs with the result. Absolute fit of the single-factor model is mediocre in every group, with RMSEA around 0.14 at the configural stage. Invariance establishes that the model is equally imperfect everywhere, which is what licenses the comparison, and it does not establish that the index is a clean unidimensional measure of one thing.
What follows
Three statements are supported by the analysis above, and each is narrow enough to defend under questioning.
- The north’s disadvantage is real and only about half compositional, so a policy response aimed purely at socio-economic disadvantage would address roughly half of the measured gap and leave the rest untouched.
- The vocational to gimnazija gap is the largest single structure in Montenegro’s 15-year-old attainment distribution, it is not mainly explained by who enters each track, and it applies to more than half the cohort.
- Mathematics anxiety differs by programme and not by region, and that comparison has been shown to be measurement-supported and not assumed.
The natural next question, which this note does not answer, is what happens to the northern gap inside programmes and inside schools, and whether it is concentrated in particular strata. An answer requires the school-level file and a multilevel decomposition, which is a larger piece of work than a note.
What this note does not claim
- No trend statement is made here. A comparison between 2022 and an earlier cycle requires the published link error for that particular pair of cycles to be carried in the variance alongside the sampling and imputation components, and without that third term a change that sits inside the margin of error is routinely reported as a rise or a fall. No such comparison is attempted here.
- No causal claim is made either. Every difference reported here is an association measured at a single point in time, without random assignment and without any control for prior attainment, and the phrase “net of ESCS” means precisely one thing: that one measured index has been held constant, not that other things are equal.
- A statement about the measurement model, not a design-based test. The invariance cascade is fitted without the replicate-weight design (standard practice in this literature), and the limitation is stated here so that no reader has to discover it.
- No official regional statistics are offered here. Montenegro is not regionally adjudicated in PISA, so the regional breakdown uses the published sampling strata, which is a sound analytical basis and is not an official regional estimate.
- Precision is limited in the small cells. The regional samples rest on 63 schools in total and the smallest programme group has 66 students, so the confidence intervals should be read and not the point estimates.
Method and reproducibility
Data: OECD PISA 2022 Public Use Files, student and school questionnaire files in SPSS format, downloaded from webfs.oecd.org on 6 August 2026 (both files dated 28 May 2024 at source).
Estimation: point estimates are pooled across ten plausible values by Rubin’s rules; the sampling variance is obtained from 80 Fay-adjusted balanced repeated replication weights (Fay factor 0.5), computed separately for each plausible value and then averaged; the imputation variance is the between-plausible-value spread inflated by (1 + 1/M); and the reported standard error is the square root of their sum. Missing data are handled casewise within each statistic, so the valid N differs from one estimate to another. Adjusted gaps come from weighted least squares carried through the same machinery, which is why their standard errors carry both error components (not the sampling component alone).
Invariance: staged configural, metric, scalar and strict cascade in lavaan, maximum likelihood with robust standard errors and full-information estimation for the rotated questionnaire design, judged against the thresholds of Chen (2007), with a sensitivity re-run using diagonally weighted least squares on ordered items and pairwise-present data.
Verification: the analysis code carries golden tests whose expected answers come from theory and not from a previous run, including a Hadamard replicate design in which the Fay-adjusted replicate variance of a weighted total must equal the analytic paired-selection variance exactly.
Subgroups are derived from variables coded identically in every participating system. That coding is what allowed production of this note without any country-specific recoding, and it is what puts the same analysis within reach of any participating country at a fixed price. Where a country’s own sampling strata carry a structure of greater policy relevance than the standard coding – and in several systems they do – that structure is used instead, and the note says so at the point where it matters.
Enquiries about reproducing this analysis are welcome. Commissioning the equivalent for another country is consulting work and is handled by AdriaMont Consulting DOO at milos@centerforpsychology.me.
All country notes in this series
About
Dr Milos Kankaras is a psychometrician and policy analyst with more than twenty years of international large-scale assessment work, including with the OECD, UNESCO and Eurofound. His published specialism is measurement equivalence and cross-cultural comparability. He holds a PhD in social sciences from Tilburg University.
This note is one of a series of country notes produced from the same analysis code. Published by the Center for Psychology, Podgorica. Commissioning enquiries go to milos@centerforpsychology.me.
Dr Milos Kankaras | milos@centerforpsychology.me | miloskankaras.com | centerforpsychology.me | ORCID | LinkedIn